Utilities¤
This module holds bits of code that are quite generic and don't fit anywhere else.
Mathematical functions¤
extra.utils.gaussian ¤
Gaussian profile.
If norm=True the profile is normalized in the sense that:
Parameters:
| Name | Type | Description | Default |
|---|---|---|---|
x
|
(array_like, float)
|
Function argument |
required |
y0
|
float
|
Vertical offset |
required |
A
|
float
|
Amplitude |
required |
μ
|
float
|
Expected value |
required |
σ
|
float
|
Standard deviation |
required |
norm
|
bool
|
Whether to normalize the Gaussian |
True
|
Returns:
| Type | Description |
|---|---|
array_like
|
Function value(s) |
extra.utils.gaussian2d ¤
Normalized 2D Gaussian profile.
The profile is normalized in the sense that
Parameters:
| Name | Type | Description | Default |
|---|---|---|---|
x
|
(array_like, float)
|
Function arguments |
required |
y
|
(array_like, float)
|
Function arguments |
required |
z0
|
float
|
Vertical offset |
required |
μ_x
|
float
|
Expected x value |
required |
μ_y
|
float
|
Expected y value |
required |
σ_x
|
float
|
Standard deviation for x |
required |
σ_y
|
float
|
Standard deviation for y |
required |
Returns:
| Type | Description |
|---|---|
array_like
|
Function value(s) |
extra.utils.lorentzian ¤
Normalized Lorentzian profile.
The profile is normalized in the sense that:
Parameters:
| Name | Type | Description | Default |
|---|---|---|---|
x
|
(array_like, float)
|
Function argument |
required |
y0
|
float
|
Vertical offset |
required |
A
|
float
|
Amplitude |
required |
x0
|
float
|
Location parameter |
required |
γ
|
float
|
Scale parameter |
required |
Returns:
| Type | Description |
|---|---|
array_like
|
Function value |
Array functions¤
extra.utils.find_nearest_index ¤
extra.utils.find_nearest_value ¤
extra.utils.reorder_axes_to_shape ¤
Transpose an array to match the axis order specified by a shape tuple.
All dimensions must have different sizes. One axis in target_shape may be None, a wildcard for the remainining axis in the array shape.
Plotting functions¤
extra.utils.imshow2 ¤
Display an image with reasonable defaults.
This function wraps plt.imshow() to automatically set some defaults:
- Try to set
vmin/vmaxto reasonable values. Note that settingvmin/vmaxis incompatible with thenormargument, so they will only be set ifnormis not passed. - Use an
autoaspect ratio if the images aspect ratio is too skewed (useful for displaying heatmaps). - Set
interpolation="none".
All arguments other than the ones listed below are passed to
plt.imshow(), and explicitly passing any of
vmin/vmax/aspect/interpolation will override the defaults.
Parameters:
| Name | Type | Description | Default |
|---|---|---|---|
image
|
array_like
|
The image to display. |
required |
lognorm
|
bool
|
Whether to display the image in a log color scale. |
False
|
ax
|
Axes
|
The axis to plot the image in. This will default to plt if none is explicitly passed. |
None
|
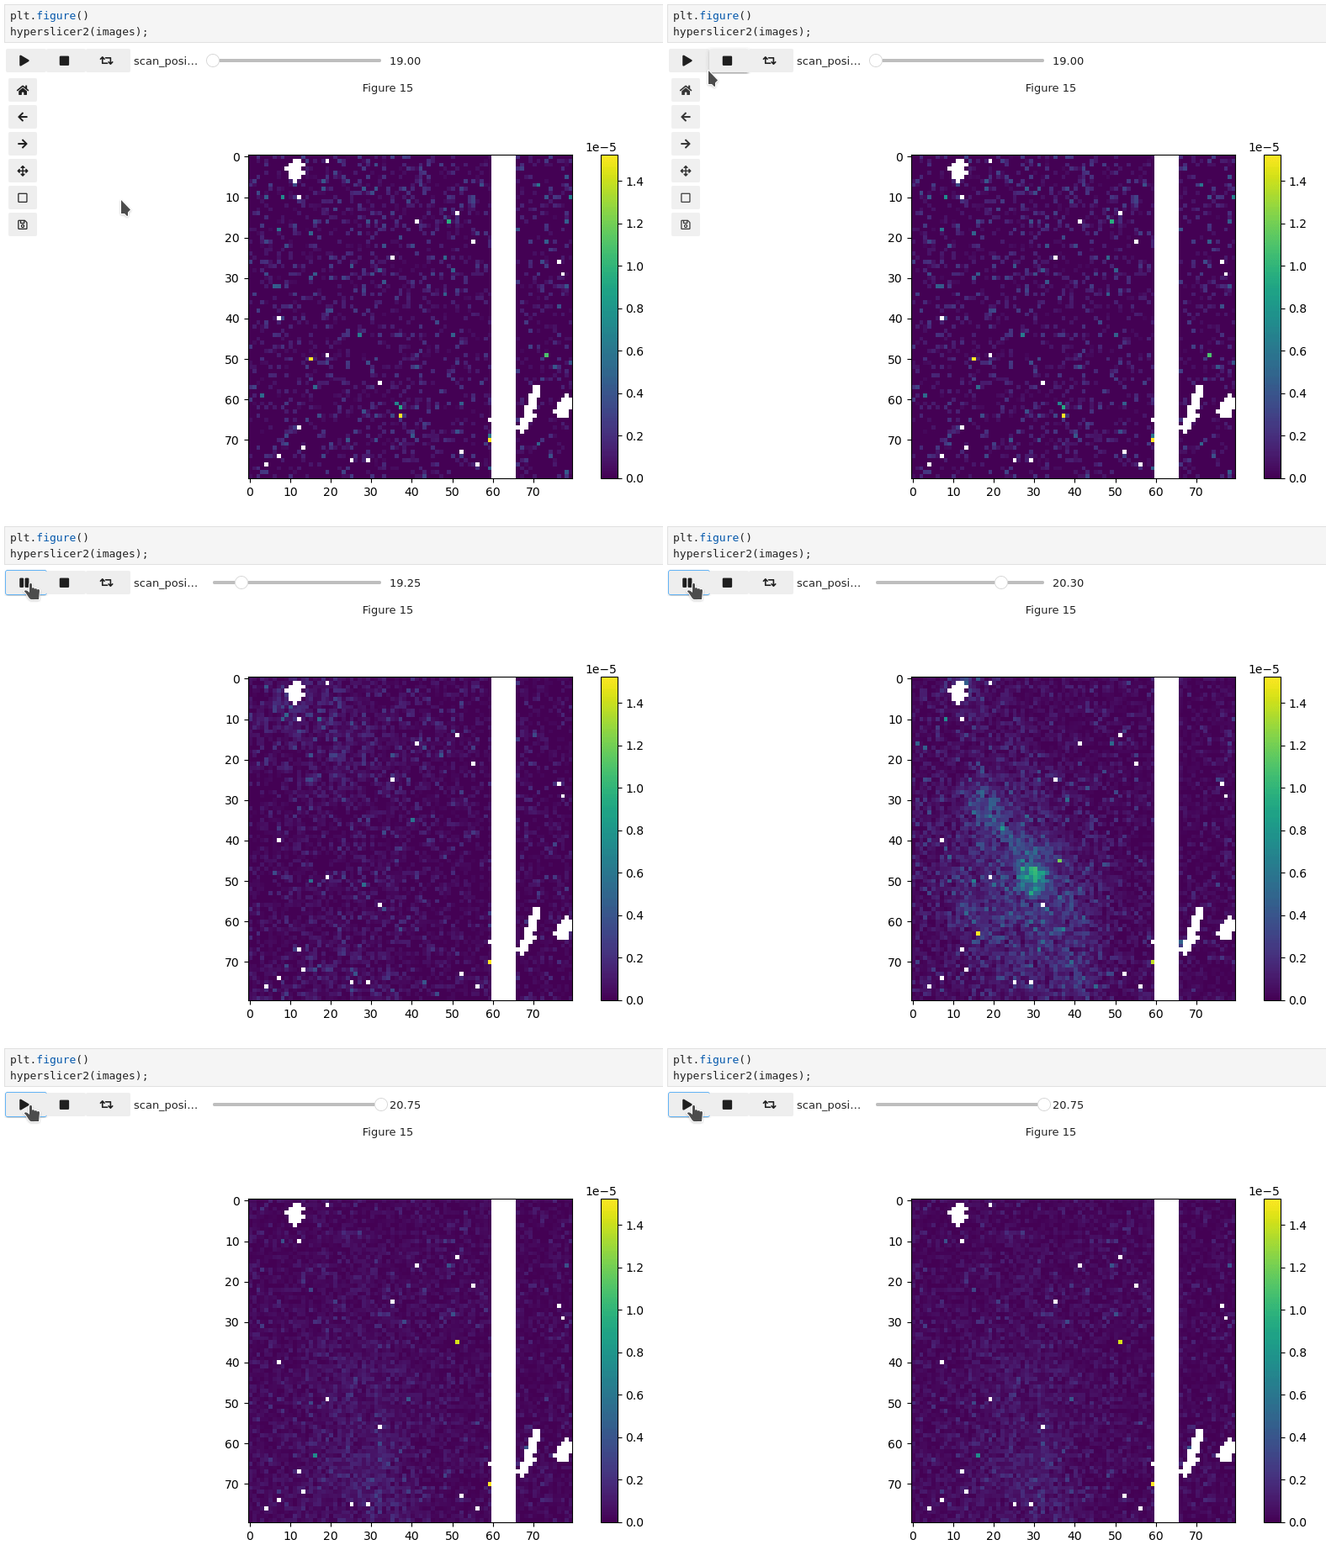
extra.utils.hyperslicer2 ¤
Interactively visualize arrays of images.
This is a lightweight wrapper around hyperslicer() with some useful defaults:
- Try to set
vmin/vmaxto reasonable values. Note that settingvmin/vmaxis incompatible with thenormargument, so they will only be set ifnormis not passed. - Set
interpolation="none". - Enable the play buttons.
- Draw a colorbar.
Example usage:
plt.figure()
# Note the trailing semi-colon to swallow the return value. hyperslicer2()
# returns a `controls` object by default that displays the play buttons, so
# returning it from a notebook cell will end up displaying the play buttons
# twice.
hyperslicer2(images);
All arguments other than the ones listed below are passed to
hyperslicer(), and explicitly
passing any of vmin/vmax/interpolation/play_buttons will override
the defaults.
Parameters:
| Name | Type | Description | Default |
|---|---|---|---|
arr
|
array_like
|
The array of images to display. Should have at least three dimensions. |
required |
ax
|
Axes
|
The axis to plot the image in. |
None
|
lognorm
|
bool
|
Whether to display the images in a log color scale. |
False
|
colorbar
|
bool
|
Whether to display a colorbar. |
True
|
Fitting functions¤
extra.utils.fit_gaussian ¤
Fit a Gaussian to some data.
This uses curve_fit() to fit a Gaussian (from
gaussian()) to ydata. If p0 is not passed the
function will set them to reasonable defaults. It will return None if
fitting fails, or if there are no finite values in ydata.
Note
By default this will only return the popt array from
curve_fit(), if you want pcov or any other
output you must pass full_output=True.
Note
When visualizing the fit results with gaussian()
make sure the norm parameters match. i.e. if you're using the default
of fitting an unnormalized Gaussian: gaussian(xdata, *popt, norm=False).
Parameters:
| Name | Type | Description | Default |
|---|---|---|---|
ydata
|
array_like
|
The data to fit. NaN's and infs will automatically be masked before fitting. |
required |
xdata
|
array_like
|
Optional x-values corresponding to |
None
|
p0
|
list
|
A list of |
None
|
norm
|
bool
|
Whether to fit a normalized or unnormalized Gaussian. |
False
|
A_sign
|
int
|
Sign of the amplitude (A) parameter for the Gaussian.
1 for an upwards peak, -1 for downwards. 0 (default) allows either,
using a faster algorithm. Passing |
0
|
**kwargs
|
All other keyword arguments will be passed to curve_fit(). |
{}
|