GUI¤
Jupyter¤
extra.gui.jupyter.SpectrometerCalibration ¤
SpectrometerCalibration(proposal: int = None, run: int = None, source: tuple[str, str] = None, image_data: ndarray = None, *, use_cache: bool = True)
An interactive Jupyter widget for performing energy calibration on 2D X-ray spectrometer detector data.
This tool provides an interface within Jupyter to guide the user through:
- Selecting regions of interest (ROIs)
- Identifying peaks within the 1D projections of those ROIs
- Providing reference energies
- Performing linear calibration fits for each ROI
- Plotting the calibrated spectra
- Saving the results
Usage¤
Provide either:
- A
proposal,run_numberand datasource: the data will be a average image of the run. - a 2D numpy array as
image_data
image_data will be used first if provided. If data is loaded from a run,
the generated average will be cached at
${Proposal}/scratch/.EXtra-gui-jupyter-SpectrometerCalibration-cache
# Ensure the ipympl backend is active for interactive plots
%matplotlib widget

import numpy as np
from extra.gui.jupyter import SpectrometerCalibration

# Create an instance of the widget.
# You can either provide data from an EuXFEL run
widget = SpectrometerCalibration(
    proposal=1234, # Your proposal number
    run=10,        # Your run number
    source=('SQS_NQS_PNCCD1MP/CAL/PNCCD_FOC_SUM', 'image.data')  # Example source
)
# or a pre-loaded NumPy array
my_xes_image = np.load("my_data.npy")
widget = SpectrometerCalibration(image_data=my_xes_image)

# Display the widget in your Jupyter cell
widget.display()

# Use the tabs in the displayed widget to perform calibration

# Save results to a file
widget.save_results()

# When finished, close the widget's figures
widget.close_all()
Widget interaction¤
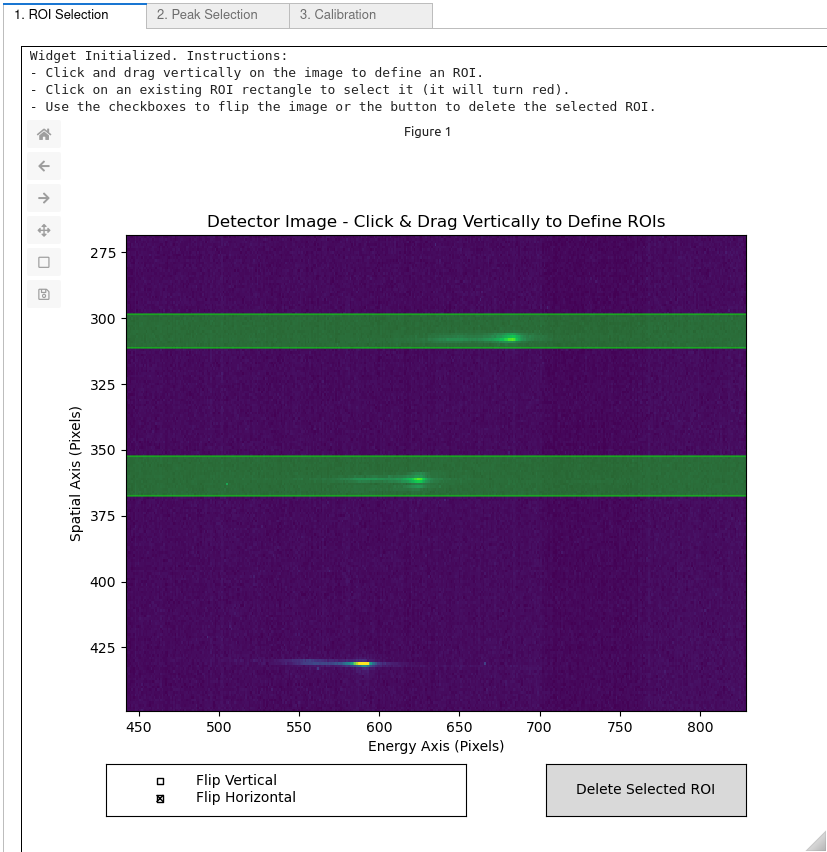
Tab 1: ROI selection¤
- Click and drag vertically on the image to define rectangular ROIs.
- To remove an ROI, click an existing ROI to select it (turns red), then use the "Delete Selected ROI" button.
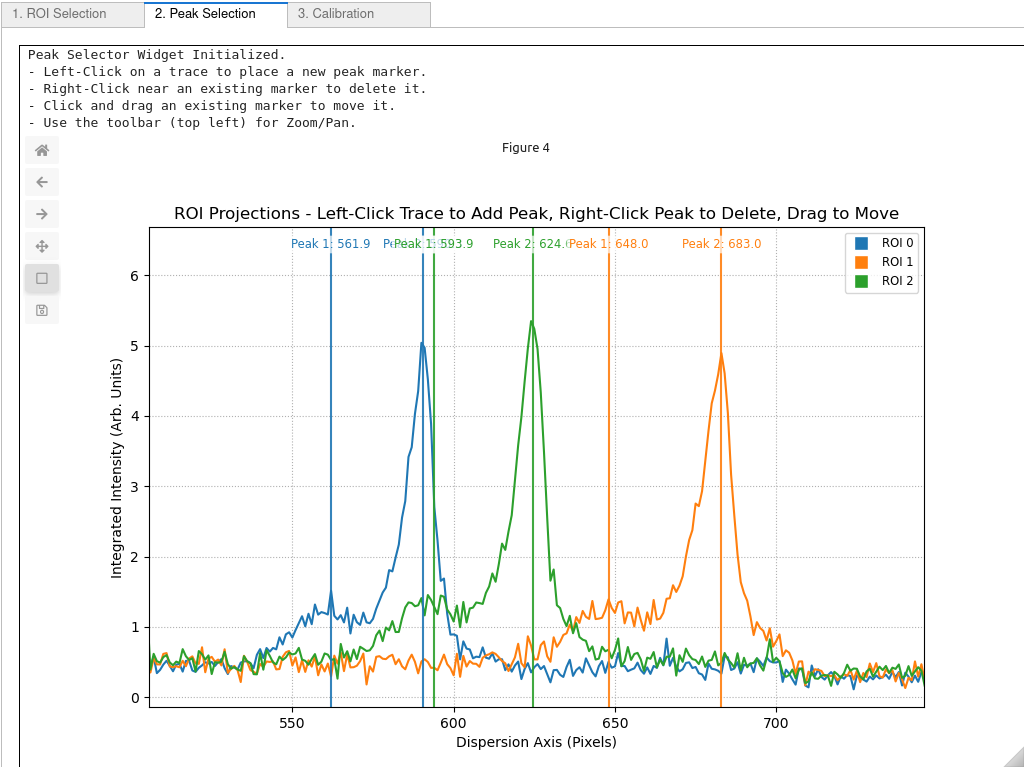
Tab 2: Peak selection¤
- View the 1D projections for each ROI.
- Left-click on a trace to add a peak marker.
- Left-click and drag an existing marker line to move it.
- Right-click near a marker line to delete it.
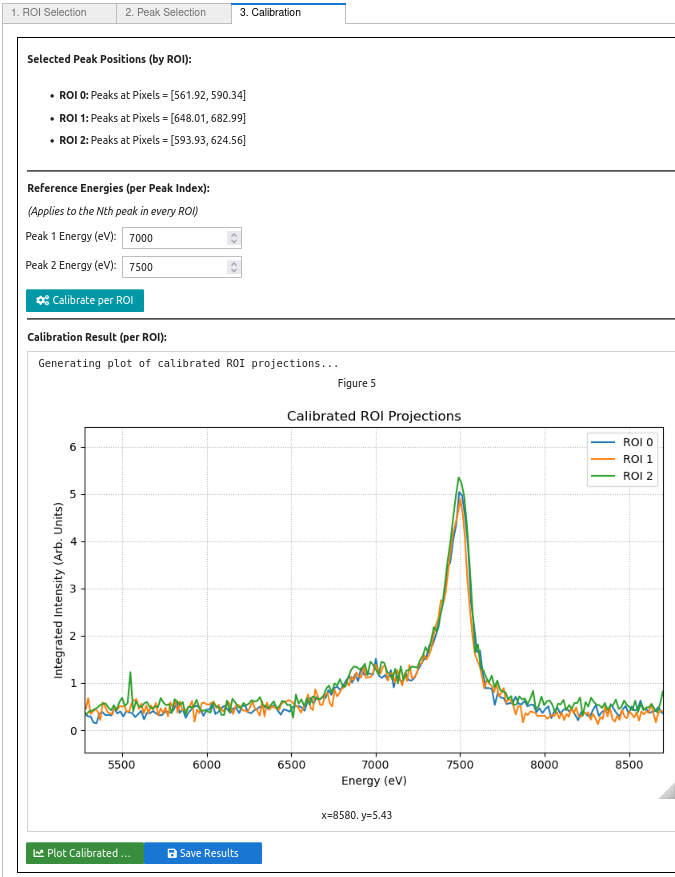
Tab 3: Calibration¤
- Review selected peak pixel positions.
- Enter known reference energies (in eV) for each peak index ("Peak 1", "Peak 2", etc.).
- Click "Calibrate per ROI". Results (slope, intercept per ROI) will appear.
- If calibration succeeds, "Plot Calibrated ROIs" and "Save Results" buttons
become active.
- Click "Plot Calibrated ROIs" to view the energy-calibrated spectra.
- Click "Save Results" to save all data (ROIs, peaks, fits, spectra) to
a
.txtfile (e.g.,spectrometer_calibration_results_YYYY-MM-DD_HH-MM-SS.txt).
Parameters:
| Name | Type | Description | Default |
|---|---|---|---|
proposal
|
int
|
Proposal number |
None
|
run
|
int
|
run number |
None
|
source
|
tuple[str, str]
|
data source |
None
|
image_data
|
ndarray
|
2D array |
None
|
use_cache
|
bool
|
try loading data from cache if True (default) |
True
|
get_selected_peak_data ¤
get_entered_peak_index_energies ¤
get_calibration_results ¤
Widgets¤
extra.gui.widgets.peak_selection.PeakSelectorWidget ¤
An interactive Matplotlib widget to select an arbitrary number of peak positions on 1D projection traces derived from ROIs of Spectrometer detector data. Adds sequential labels to markers ("Peak 1", "Peak 2", ...) and allows dragging.
Features:
- Takes 2D image data and a list of ROI definitions as input.
- Calculates and plots 1D projections (integrations along y) for each ROI.
- Left-clicking on a trace places a new peak marker (vertical line) with a label.
- Right-clicking near an existing marker deletes it.
- Labels show peak number ("Peak N") and pixel position.
- Allows interactively dragging existing markers (and their labels) to refine position.
- Provides standard zoom/pan functionality via Matplotlib toolbar.
- Returns the selected pixel positions for each ROI.
Initializes the widget.
Parameters:
| Name | Type | Description | Default |
|---|---|---|---|
image_data
|
ndarray
|
The 2D detector image data. |
required |
roi_definitions
|
list
|
A list of dictionaries, where each dict represents an ROI and must contain 'y_start' and 'y_end' keys. Example: [{'y_start': 40, 'y_end': 60}, ...] |
required |
register_peak_update_callback ¤
Register a function to be called when peak selections are updated.
get_selected_peaks ¤
Returns the selected peak positions for all ROIs.
Returns:
| Type | Description |
|---|---|
list
|
A list of dictionaries, one for each ROI processed. Each dict contains:
|
extra.gui.widgets.roi_selection.ROISelectorWidget ¤
An interactive Matplotlib widget for selecting vertical ROIs on a 2D image, typically used for analyzing detector data in X-ray Spectroscopy.
Allows adding ROIs by clicking and dragging vertically, selecting existing ROIs by clicking on them, deleting the selected ROI, and flipping the image horizontally or vertically using checkboxes.
Parameters:
| Name | Type | Description | Default |
|---|---|---|---|
image_data
|
ndarray
|
A 2D numpy array representing the detector image. |
required |